Page 97 - ar2019_en
P. 97

Appendices


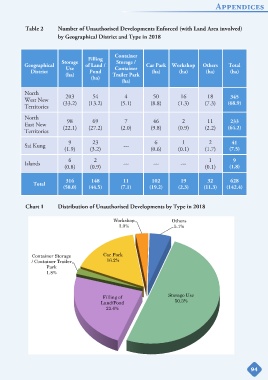
            Table 2        Number of Unauthorised Developments Enforced (with Land Area involved)
                           by Geographical District and Type in 2018


                                                    Container
                                        Filling
                            Storage                  Storage /
            Geographical      Use      of Land /    Container     Car Park  Workshop       Others      Total
               District                  Pond                       (ha)         (ha)       (ha)       (ha)
                              (ha)                 Trailer Park
                                         (ha)
                                                       (ha)

            North
            West New          203         54            4            50          16          18        345
            Territories      (33.2)     (13.2)         (5.1)        (8.8)       (1.3)       (7.3)     (68.9)


            North              98         69            7            46           2          11
                                                                                                       233
            East New         (22.1)     (27.2)         (2.0)        (9.8)       (0.9)       (2.2)     (64.2)
            Territories

                               9          23                          6           1           2         41
            Sai Kung                                    ---
                              (1.9)      (3.2)                      (0.6)       (0.1)       (1.7)      (7.5)

                               6           2                                                  1          9
            Islands                                     ---          ---         ---
                              (0.8)      (0.9)                                              (0.1)      (1.8)


                              316         148           11          102          19          32        628
                Total
                             (58.0)     (44.5)         (7.1)       (19.2)       (2.3)      (11.3)     (142.4)


            Chart 1        Distribution of Unauthorised Developments by Type in 2018


                                                                                                                94
   92   93   94   95   96   97   98   99   100   101   102