Page 109 - ar2018_en
P. 109

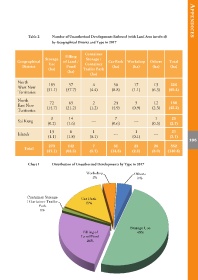
Table 2       Number of Unauthorised Developments Enforced (with Land Area involved)              Appendices
                                by Geographical District and Type in 2017


                                                    Container
                                        Filling
                            Storage                  Storage /
           Geographical                of Land /                  Car Park  Workshop       Others      Total
              District        Use        Pond       Container        (ha)        (ha)        (ha)      (ha)
                              (ha)                 Trailer Park
                                          (ha)
                                                       (ha)

            North
            West New          185         57             4           50           17          13        326
            Territories      (31.1)      (37.7)        (4.4)        (8.8)        (1.1)      (6.3)     (89.4)

            North              72         65             2           24           5           12
            East New         (14.7)      (21.2)        (1.2)        (4.9)        (0.9)      (2.3)       180
            Territories                                                                               (45.2)


                                3         14                          7                       1         25
            Sai Kung                                    ---                       ---
                              (0.2)      (1.6)                      (0.6)                   (0.3)      (2.7)
                               13          6             1                        1                     21
            Islands                                                  ---                      ---
                              (1.1)      (1.8)         (0.1)                     (0.1)                 (3.1)
                                                                                                                   106
                              273         142            7           81           23          26        552
                Total
                             (47.1)      (62.3)        (5.7)        (14.3)      (2.1)       (8.9)     (140.4)


                  Chart 1       Distribution of Unauthorised Developments by Type in 2017
   104   105   106   107   108   109   110   111   112   113   114