Page 53 - ar2019_en
P. 53

Focus


                              Chart 10: Number of Frequent Trip Makers between Hong Kong and
                                        the Mainland by Type of Frequent Trip Makers


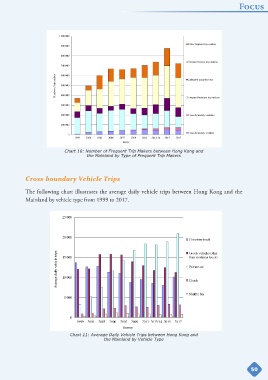
            Cross-boundary Vehicle Trips


            The following chart illustrates the average daily vehicle trips between Hong Kong and the
            Mainland by vehicle type from 1999 to 2017.


                                Chart 11: Average Daily Vehicle Trips between Hong Kong and
                                               the Mainland by Vehicle Type


                                                                                                                50
   48   49   50   51   52   53   54   55   56   57   58